The Science of Seeing Before Ordering
There's a moment every restaurateur knows: a guest opens the menu, hesitates, and orders the safest-sounding option on the page. Not because they didn't want the wagyu beef tataki or the mango sorbet — they simply couldn't picture it. That hesitation, multiplied across dozens of covers per service, costs real money.
The question is: what does the evidence actually say about whether AR and 3D menus change this behaviour?
The answer, across multiple studies, is unambiguous. Restaurants implementing interactive 3D and AR menu items report average order value uplifts of 20–26% compared to equivalent periods with static menus, according to cross-platform restaurant industry data. Menu psychology research confirms that dishes presented with high-quality visual aids sell at rates 25–30% higher than text-only listings. And the underlying mechanism — risk reduction through visual confirmation — has been validated in peer-reviewed consumer psychology research published in Frontiers in Psychology and MDPI Journals.
Why Visuals Override Text: The Neuroscience
The human brain processes visual information 60,000 times faster than text. This isn't a marketing claim — it's a consistent finding across neuroscience and cognitive psychology research, frequently cited in neuromarketing literature.
When applied to food, the implications are powerful. Research documented in the Journal of Consumer Psychology identifies four specific mechanisms through which 3D food visualisation affects ordering behaviour:
- Risk reduction — In a digital environment, guests can't physically inspect food. 3D visuals provide "visual confirmation" of portion size, ingredient composition, and appearance, reducing the uncertainty that causes conservative ordering.
- Appetite stimulation — High-quality 3D renderings trigger physiological and emotional responses that static descriptions cannot. The response is faster and more intense than text-based descriptions.
- Cognitive ease — When guests can easily visualise a product's texture, shape, and quality, information processing becomes more efficient. Lower cognitive load leads to more positive evaluations and higher purchase intent.
- Mental imagery (sensory simulation) — 3D visualisation facilitates what researchers call "eating with the mind's eye" — the guest imagines the experience of eating the food, which increases desire and purchase likelihood.
A study from Queen Mary University of London added an important nuance: for common, descriptive dish names, adding images consistently improves ordering behaviour. For "ambiguous" or creative dish names, however, images can sometimes create confusion. The practical implication: pair clear dish names with visual media for maximum impact.
The Average Order Value Opportunity
The most commercially important metric for most restaurant operators is average order value (AOV). A 10% lift in AOV with zero additional covers is the equivalent of adding a table of guests every service — without the staffing, the cleaning, or the kitchen pressure.
Industry data from 2024–2025 across multiple platforms shows consistent results. Restaurants implementing integrated QR-ordering systems with visual menus report AOV increases of 12–35%, according to cross-platform analyses from sundayapp.com, foxifood.com, and shirainfotech.com. Some platforms report broader sales increases of 25–60% for venues that fully integrate digital ordering with their POS systems.
The mechanisms behind the uplift are well-understood:
- Guests discover dishes they would have overlooked in text-only menus
- Premium items (larger portions, upsells, add-ons) become understandable at a glance
- Option customisation — "add avocado", "upgrade to XL" — becomes a visual interaction rather than an abstract text choice
- Digital menus can strategically suggest relevant add-ons at the point of decision
- Guests feel confident in their choices, reducing the "I'll just have the usual" effect
Research from the menu psychology field confirms that high-quality images of menu items can increase sales for those specific items by 25–30%. The combination of vivid, sensory-rich text with appealing 3D visuals is more effective than either element alone — what researchers call a "multimodal" experience that increases willingness to pay.
What Happens Without Images
The inverse is equally well-documented. Consumer research across Australian dining venues shows that 65% of guests have abandoned a dish choice because they couldn't find a photo or visual reference. In practice, they default to items they recognise — typically lower-margin staples rather than signature dishes.
The gap between flat photography and 3D is smaller than you might expect for common dishes, but it grows substantially for dishes that are unfamiliar to the guest. For restaurants serving cuisines that aren't native to the local market — Japanese food in Melbourne, Indian food in Tokyo, Ethiopian food in Sydney — the 3D advantage is most pronounced. Guests who have never eaten a dish before need spatial context that a photograph cannot provide.
AR on a Phone: No App Required
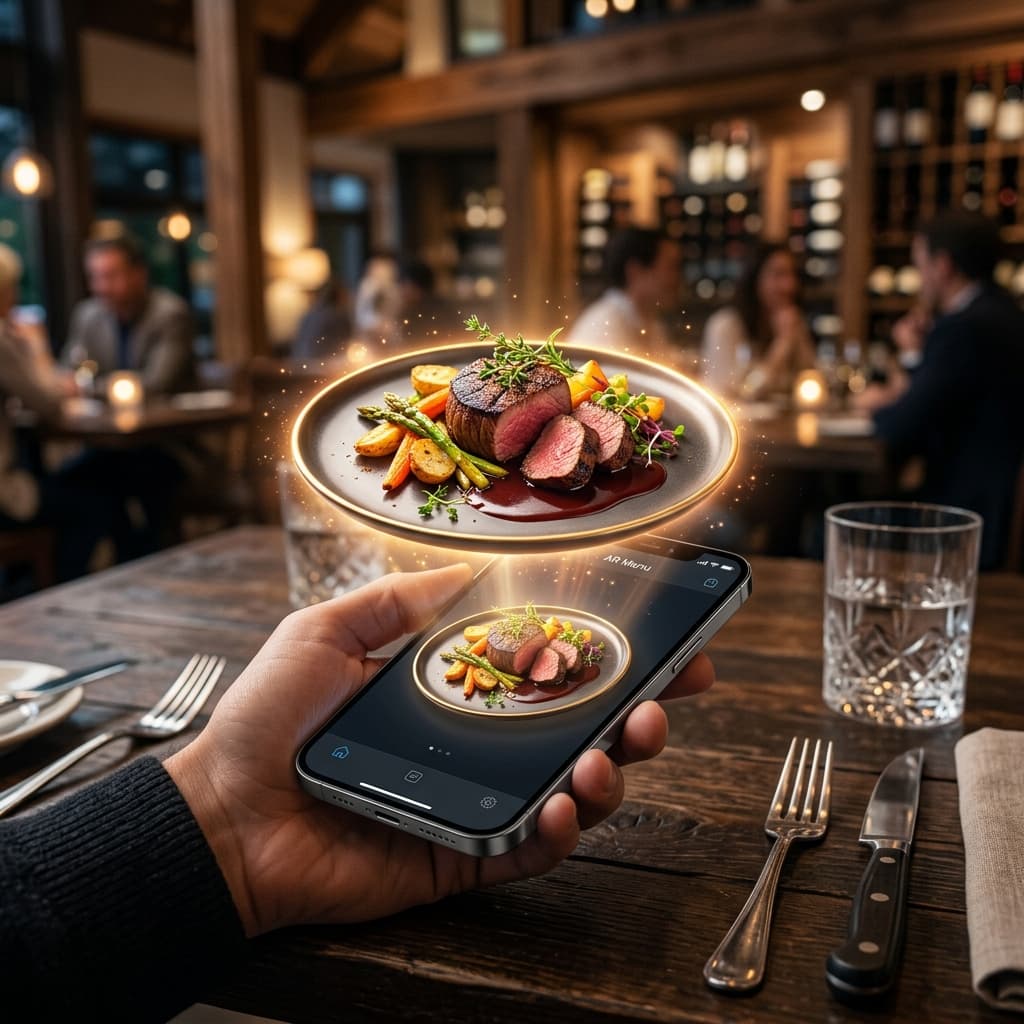
One of the persistent misconceptions about AR menus is that they require a dedicated app. Modern AR food models render directly in a mobile browser — both iOS (via AR Quick Look) and Android (via Scene Viewer) support this natively.
The flow for a guest is: scan the table QR code → browse the menu → tap the AR button on any modelled dish → the dish appears on their actual table in augmented reality, at real scale. No app. No login. No friction.
This matters commercially because app install rates for restaurant-specific applications are extremely low. If the technology requires a download, most guests will not use it. Browser-native AR eliminates this barrier entirely.
Which Dishes Benefit Most from 3D Modelling
Not every dish needs a 3D model. The research suggests prioritising in this order:
- Signature or hero dishes — the items you most want to sell and are most proud of
- High-margin items — dishes where a conversion lift directly improves profitability
- Unfamiliar dishes — anything that requires explanation or that local guests may not recognise
- Premium upgrades — larger portions, combination plates, special bundles where the visual size difference justifies the price premium
A restaurant with 40 items on the menu does not need 40 3D models on day one. Starting with 8–12 hero items captures the majority of the uplift.
The Direction of Travel
The global restaurant technology market was valued at approximately $6.9–8.2 billion in 2026, with projections to reach $18–27 billion by the mid-2030s at a CAGR of 14–16%, according to 360iresearch.com. The National Restaurant Association's 2025 report found that 83% of restaurant operators view technology as a competitive advantage, and 71% of Gen Z consumers now expect technology options when dining at full-service restaurants.
The restaurants winning on average order value in 2026 share a common trait: they treat the digital menu as a sales tool, not a listing document. A text-and-price list is the minimum viable menu. A 3D interactive experience is a revenue multiplier.
The conversion data is mature enough that waiting for more evidence is itself a cost. Start with the three dishes you most want to sell. Put them in 3D. Measure the change.